Retail Summer Sales
Understanding how well a product that is published on the E-Commerce platform Wish is going to sell using Machine Learning.
Overview
In this study, I extracted 10 significant features out of 43 provided in the dataset and trained a Linear Regression model that predicts “units_sold” of products.
Evaluation Metrics used: Mean absolute error and R-Squared
Findings
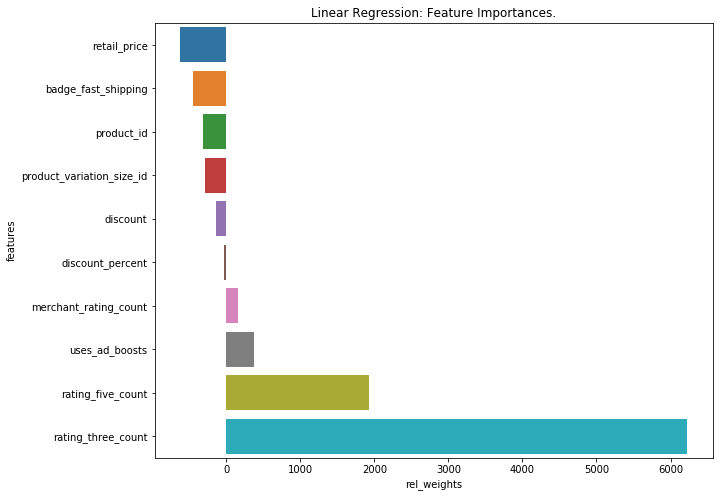
It is observed that out of the 10 features, products marked rating 3 and 5 have a significant positive impact on sales, followed by merchants who used ad boosts, their total rating count, discount percent on the product, with a retail price of the product having a significant negative impact.
Sales Estimator Equation:
units_sold = (uses_ad_boosts x 642.80) + (rating_three_count x 15.06) + (rating_five_count x 3.33) + (merchant_rating_count x 0.003) + (product_id x -0.850) + (discount x -1.73) + (discount_percent x -6.038) + (product_variation_size_id x -10.65) + (retail_price x -16.418) + (badge_fast_shipping x -3173.258)
Note: Weights for each feature are absolute weights, may differ from relative weights obtained by transforming features to a common scale, which is depicted in the plot below
Relative Weights :
Data Source
The Summer Sales data used contains sales data of products published on E-Commerce platform Wish.